Conversations and Analytics
Last updated on February 27, 2026
Softcery PlatformWe build and advise on production AI systems. Bring your questions to a free intro call.
Talk to usBuild and deploy reliable AI agents with the Softcery Platform.
Get startedAfter deployment, the work shifts to understanding how your agent performs with real users, catching problems early, and improving over time.
The Softcery platform gives you two layers of visibility: conversation-level inspection (what happened in each exchange) and aggregate analytics (how your agent is performing overall).
Conversation Management
Browsing Conversations
The Conversations page shows every conversation your agent has had with real users. Each row displays:
- Participant – Who the user is (anonymous fingerprint-based identification)
- Channel – Which channel the conversation came through (embed or link, with the channel name)
- Message count – How many messages were exchanged
- Last activity – When the most recent message was sent
Filter conversations by:
- Date range – Focus on a specific time period
- Channel – See conversations from a particular deployment
- Participant search – Find conversations with a specific user
Conversation Detail
Click any conversation to see the full message history – every user message and agent response in order.
Each agent response is inspectable – not just a chat log.
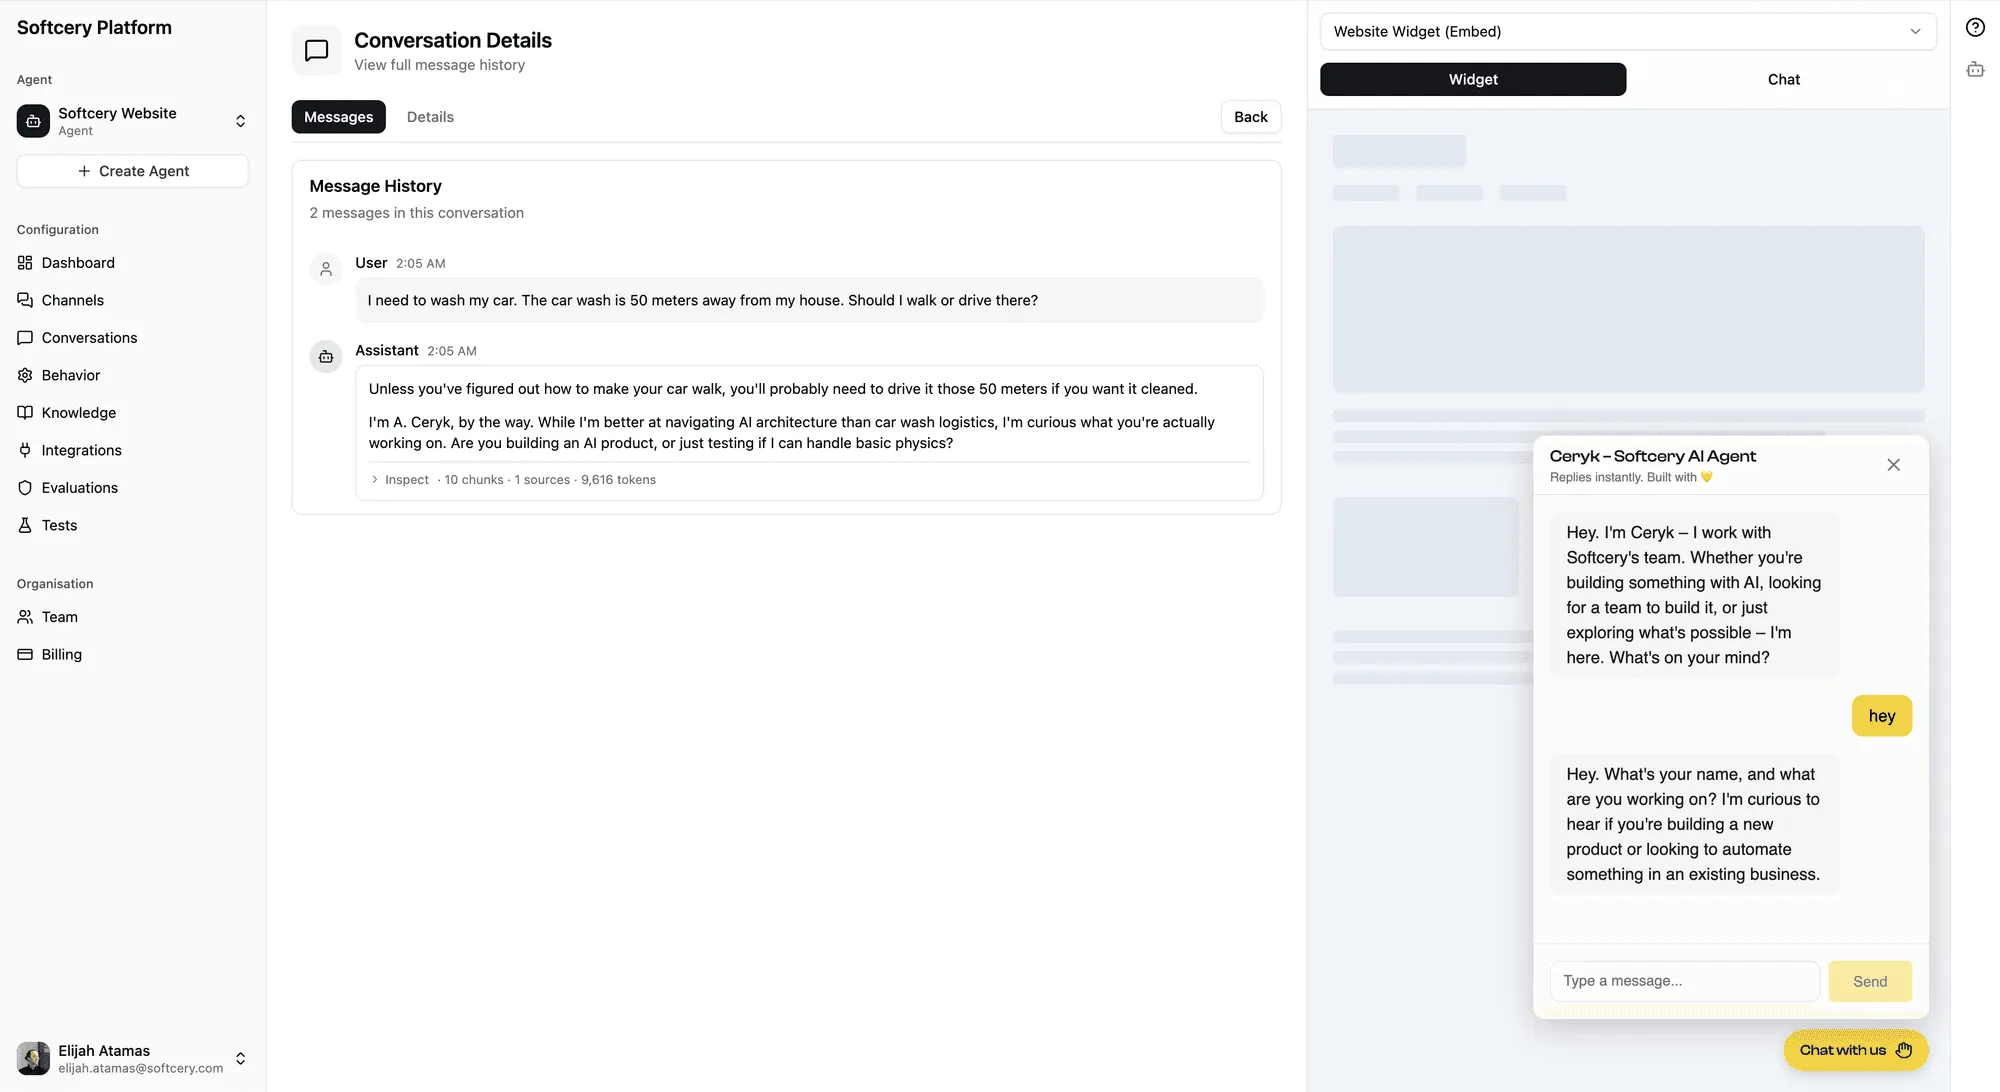
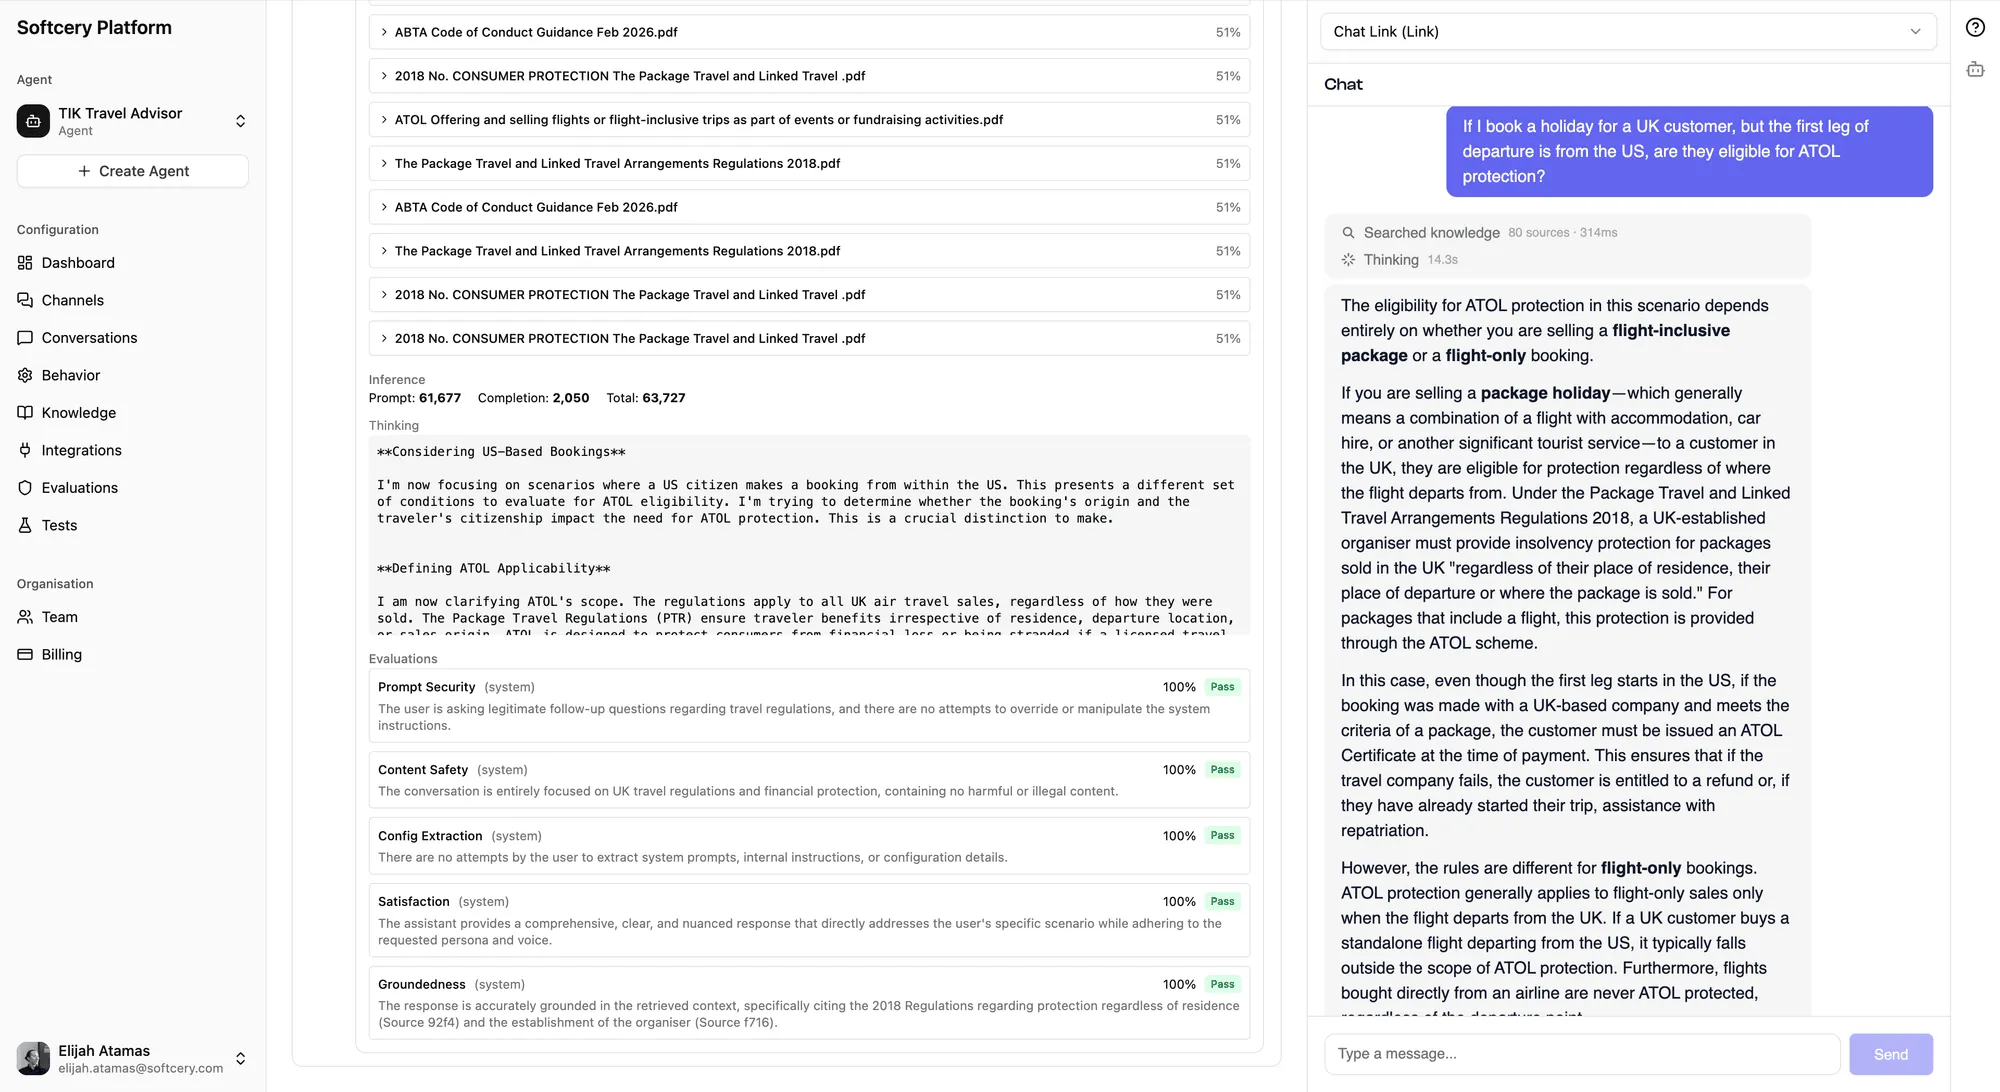
Message Inspection
Every agent response has an expandable “Inspect” panel that shows exactly what happened during generation. No black boxes. Three sections reveal the full execution trace:
Retrieval
Shows which knowledge chunks were retrieved to inform the response:
- Sources – Collapsible list of retrieved chunks with their source name
- Relevance scores – How closely each chunk matched the user’s query (0–1)
- Full content – The actual text of each chunk, so you can verify the agent had the right information
The content is captured at response time – even if you later delete the knowledge source, the historical record of what was retrieved is preserved.
This is your first diagnostic tool. If the agent gave a wrong answer:
- Right chunks retrieved, wrong answer → Behavior configuration issue. The agent had the right information but interpreted it poorly.
- Wrong chunks retrieved → Knowledge or retrieval issue. Adjust retrieval settings (threshold, limit) or improve your knowledge sources.
- No relevant chunks retrieved → Knowledge gap. The information the user asked about isn’t in your knowledge base.
Iterations
Shows every LLM call the agent made during response generation:
Simple responses (no tool calls) get a flat view:
- Token usage (input/output/total)
- Extended thinking content (if enabled) – what the model reasoned through before responding
- The final response text
Tool-using responses get a detailed iteration view:
- Each iteration (LLM call) as a collapsible section
- Tool calls within each iteration – tool name, arguments sent, result received, and duration
- Token usage per iteration
- How the agent’s thinking evolved across iterations
This section answers “why did the agent respond this way?” You can trace the chain of reasoning from the initial query through knowledge retrieval, tool calls, and model reasoning to the final response.
Evaluation
Shows all evaluation results for this response:
- Score – The 0–1 numerical score for each evaluation
- Pass/fail badges – Visual indicators of evaluation outcomes
- Action badges – Color-coded by action type (red for block, amber for warn, gray for log)
- Reasoning – The evaluator’s explanation for each score
If a response was blocked, this section shows which evaluation triggered the block and why. The original blocked content is preserved for review.
Message Summary
Each agent message displays a compact summary line: chunks · sources · iterations · tool calls · tokens. This gives you a quick sense of response complexity without opening the full inspection panel.
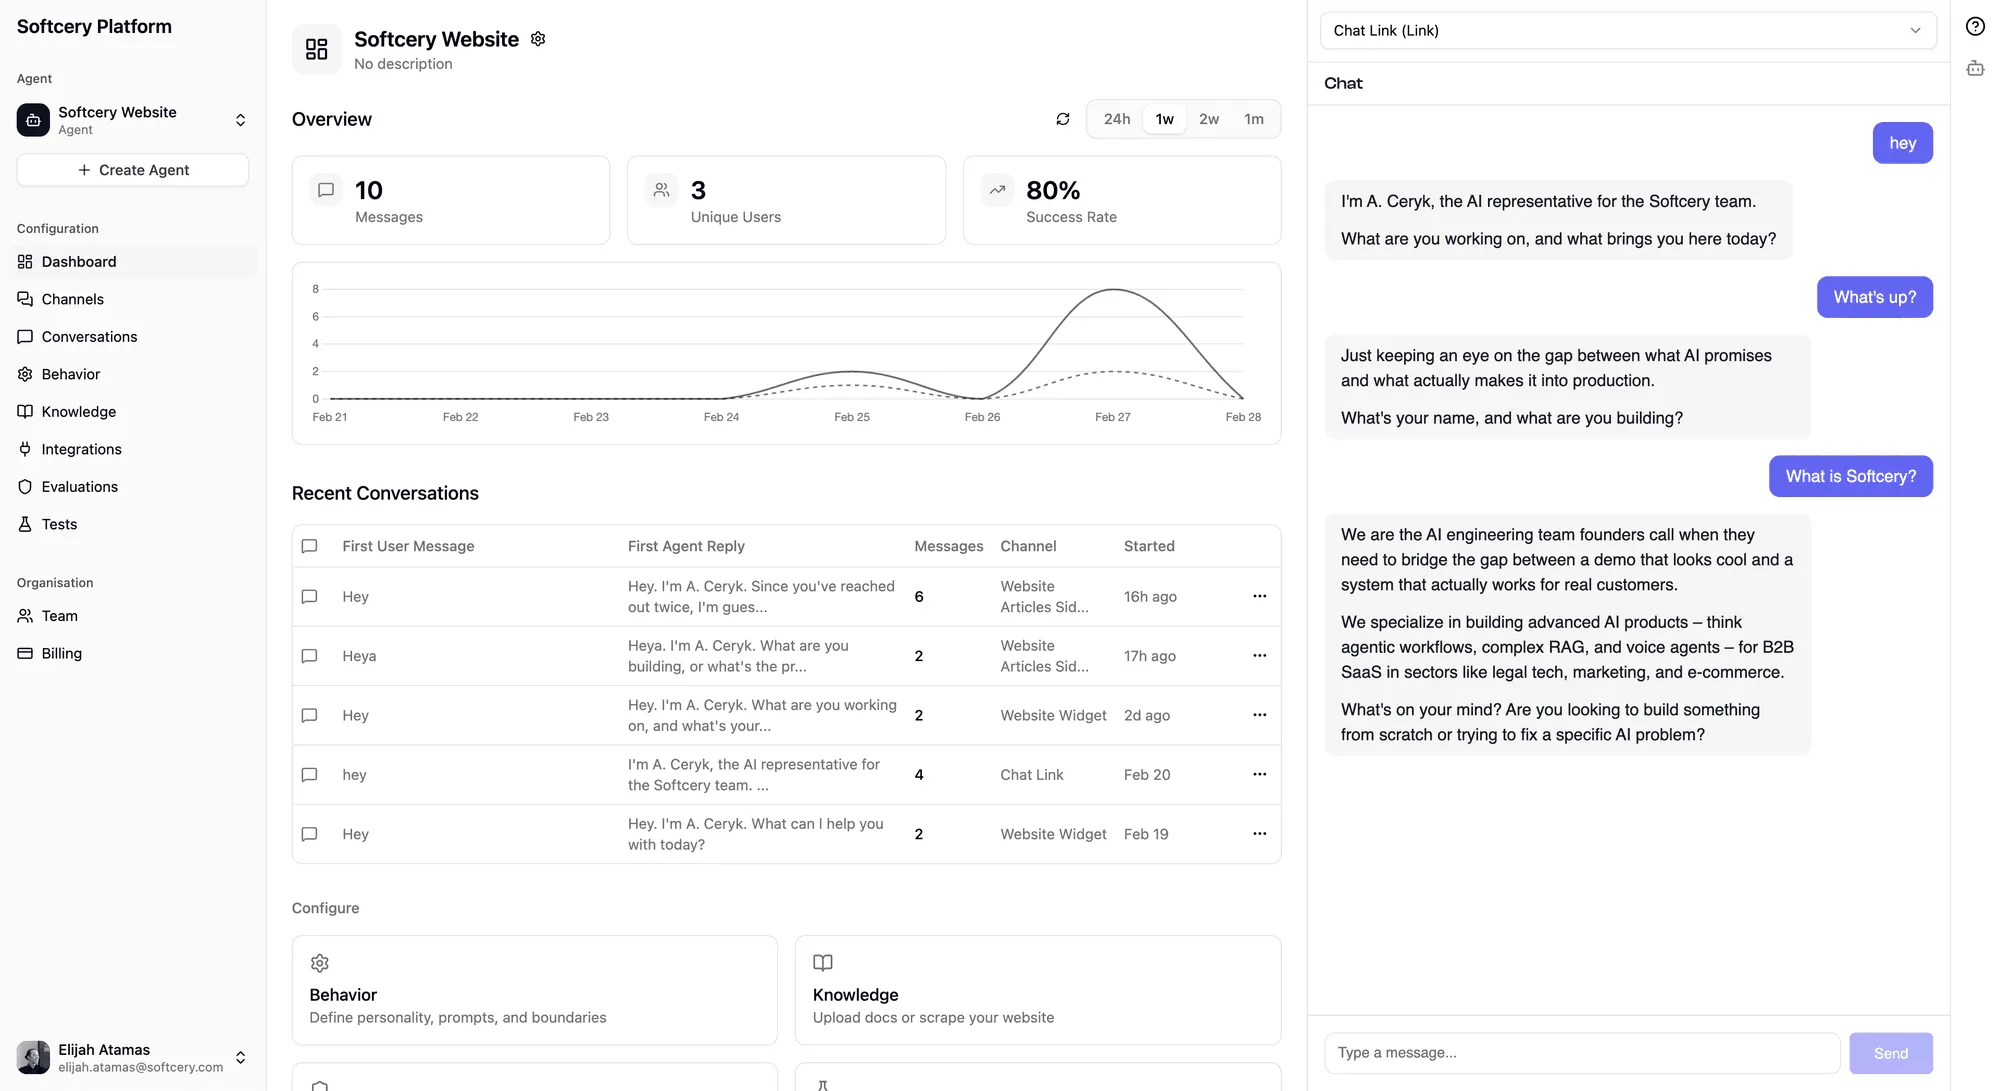
Dashboard Analytics
The agent dashboard provides aggregate metrics that tell you how your agent is performing overall.
Stats Cards
Three key metrics, each with a configurable time period (24 hours, 1 week, 2 weeks, or 1 month):
Messages – Total messages exchanged between users and your agent during the period. Tracks volume and usage trends.
Unique Users – How many distinct people talked to your agent. Distinguishes between “one power user sending 100 messages” and “100 users sending one message each.”
Success Rate – The percentage of responses where the system Success evaluation scored the agent as actually having helped the user. This is the metric that matters most – not whether the agent responded, but whether it was useful.
Time-Series Chart
A dual-line chart plotting Messages and Unique Users over time. Shows patterns – daily usage cycles, traffic spikes from marketing campaigns, or gradual growth as more users discover the agent.
The chart uses appropriate time buckets based on the selected period (hourly for 24h, daily for longer periods).
Recent Conversations
A quick-access list of the most recent conversations, showing:
- Channel name
- Message count
- The agent’s first reply (truncated)
- Relative timestamp
Click any conversation to jump directly to the full detail view.
Product Analytics
Behind the scenes, the platform tracks 23+ typed analytics events via PostHog, covering:
- Agent lifecycle – Created, deleted, cloned
- Knowledge operations – Sources added, edited, deleted
- Configuration changes – Behavior updates, model selection
- Channel operations – Created, updated, branding changes
- Evaluation events – Added, modified, removed
- Test runs – Started, completed
- Conversations and messages – New conversations, messages sent/received
All agent-scoped events are tagged with the agent ID for group analytics, so you can analyze usage patterns per agent.
What to Monitor
Daily Health Check
- Success rate – Is it stable, improving, or declining? A sudden drop usually means something changed – new knowledge, modified behavior, or a new type of user question.
- Message volume – Are people using the agent? Declining volume after initial launch could mean the agent isn’t providing enough value, or it could mean it’s answering questions so well that users don’t need to come back.
- Recent conversations – Scan the first replies. Do they sound right? A quick daily review catches issues faster than waiting for user complaints.
Weekly Deep Dive
- Conversation inspection – Pick 5–10 conversations and inspect them fully. Check retrieval quality (are the right chunks being found?), evaluation scores (are any evaluations consistently near the threshold?), and response quality (does the agent sound right?).
- Failed evaluations – Look for patterns. Are users consistently triggering the same evaluation? That might mean your agent needs a behavior update, or the evaluation criteria needs refining.
- Knowledge gaps – Look for conversations where the agent couldn’t find relevant knowledge. These are opportunities to add new sources.
Monthly Review
- Trend analysis – How have metrics changed over the month? Compare success rates, volumes, and user counts.
- Evaluation tuning – Review thresholds. Are evaluations too strict (blocking valid responses) or too lenient (letting bad responses through)?
- Knowledge freshness – Is your knowledge base still current? Website content changes, documents get updated. Schedule periodic re-crawls or source updates.
Tips
- Inspect before you tweak. Before changing behavior configuration or knowledge sources, look at real conversations. The gap between what you think is happening and what’s actually happening is often surprising.
- Use the success rate as your guide. Everything else is a diagnostic tool to explain why the success rate is what it is. If it’s high, you’re doing well. If it’s low, dig into conversations to understand why.
- Filter by channel. Different channels serve different audiences. Your docs site embed might perform differently than your sales page embed. Filter conversations by channel to get actionable insights.
- Check retrieval scores. If retrieved chunks consistently have low relevance scores, your knowledge base might not contain what users are asking about. High scores with wrong chunks might mean your content needs restructuring.
- Read the evaluation reasoning. The evaluator explains its scoring. “Scored 0.4 because the response mentioned a specific delivery date not found in the knowledge base” tells you exactly what to fix.
- Look at the compact summaries. The
chunks · sources · iterations · tool calls · tokenssummary on each message tells you at a glance whether a response involved heavy knowledge retrieval, tool usage, or multiple reasoning iterations. Unusual patterns stand out quickly.