AI Build Pack Parser: From Static PDFs to Interactive Network Diagrams
Fiber Installation Company Cuts Build Pack Processing Time by 90% with AI-Powered Diagram Extraction
Fiber FLO needed to extract network topology data from complex PDF build pack diagrams. Manual transcription took hours per document and introduced errors. We built an AI vision system that processes multi-page PDFs, outputs structured JSON, and renders interactive diagrams – automatically.
The Problem
Fiber installation companies receive build pack documents from network providers like Virgin Media, Netomnia, and Go Fibre. These multi-page PDFs contain cable chain straight line diagrams – dense visual maps showing hundreds of cables, nodes, closures, and their interconnections across fiber networks.
What Build Packs Actually Contain
A typical build pack runs 20-50 pages. Most pages contain administrative information, specifications, and compliance documentation. Buried somewhere in the middle sits the cable chain straight line diagram – the critical page that maps the entire network topology for an installation project.
These diagrams encode dense information. Each node represents a physical closure point (labeled L2, L3, etc. indicating hierarchy level). Each connecting line represents a cable run with an ID, type classification, and length in meters. A single diagram might contain 50+ nodes and 100+ cable connections, all with precise identifiers that field teams need for installation work.
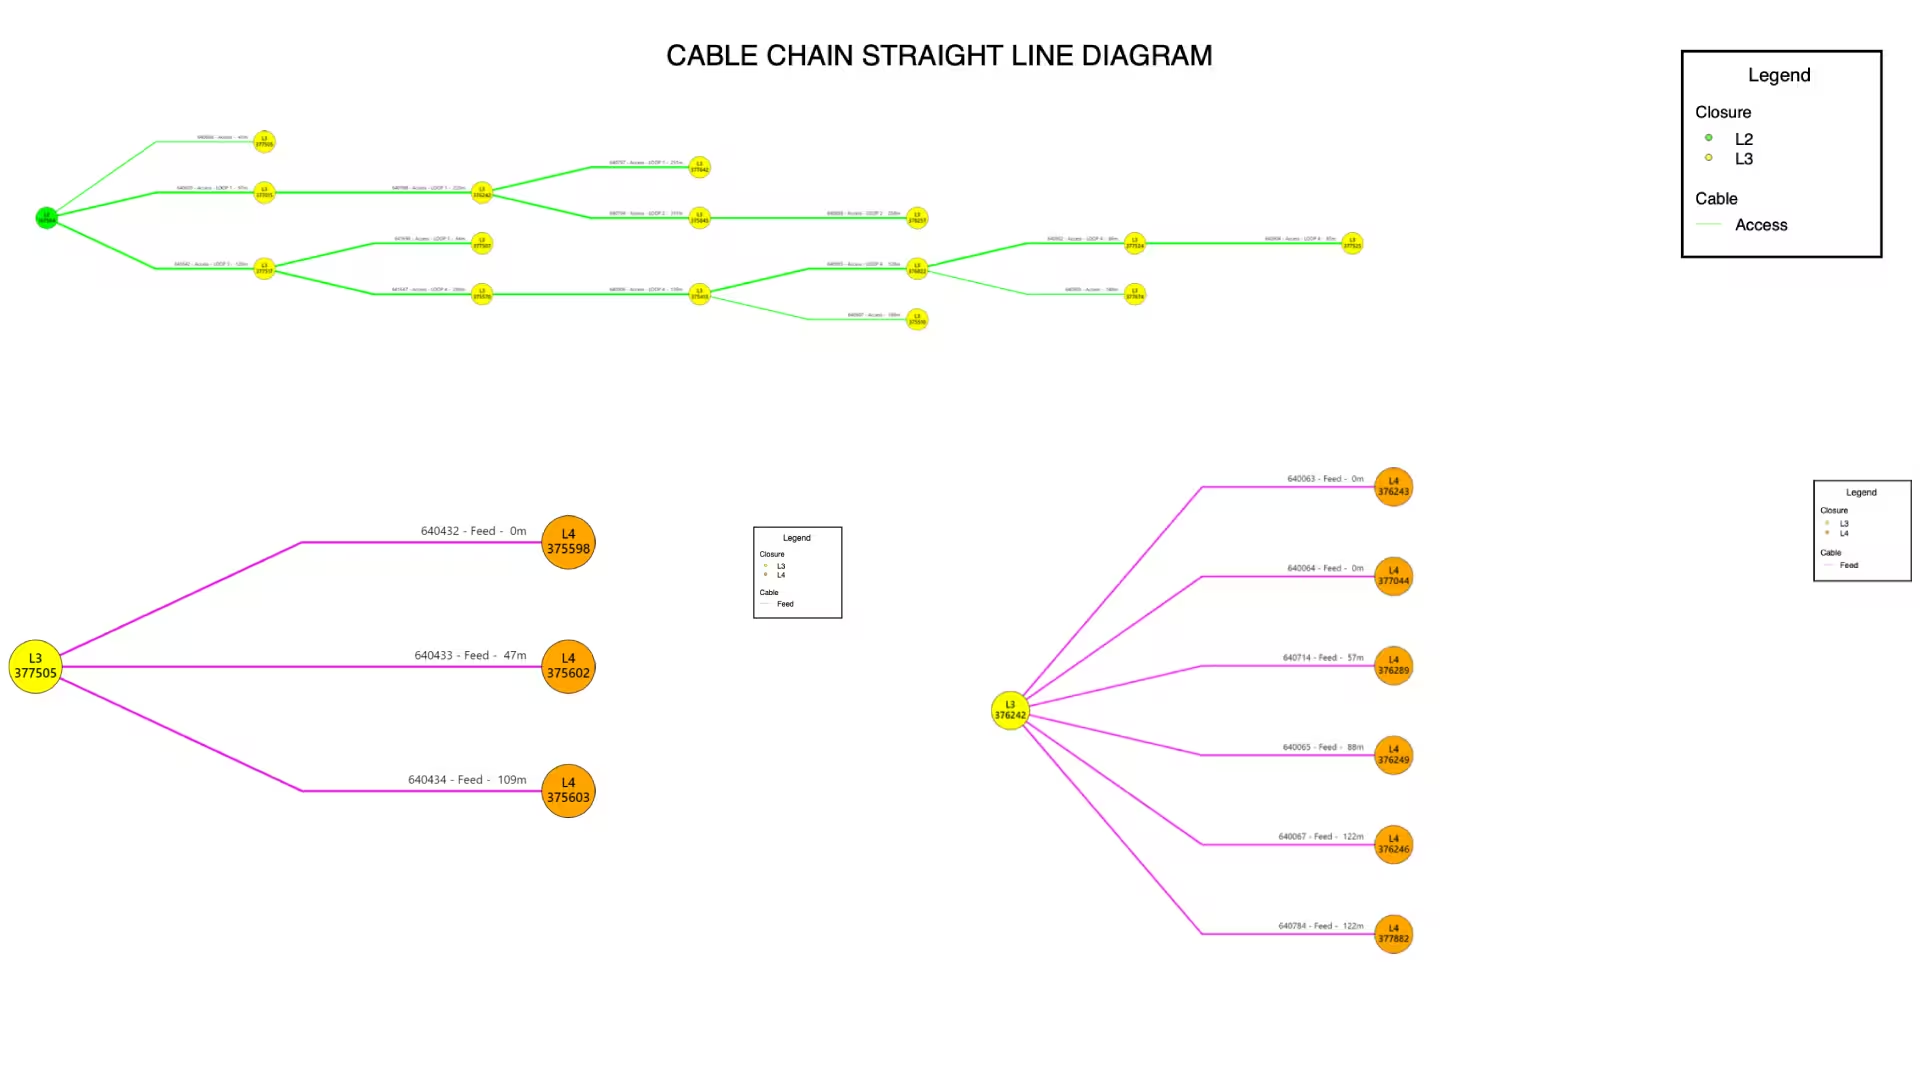
The challenge: this information exists only as a visual diagram. No metadata. No database export. Just lines, circles, and text labels rendered as vectors or raster images inside a PDF.
The Manual Process
Project managers currently handle build packs through a painful workflow. They open the PDF, locate the diagram page by scrolling through the document, then begin manual transcription. Each node ID gets typed into a spreadsheet or project management system. Each cable connection gets recorded with its source node, destination node, cable ID, and length.
This process takes 2-4 hours per build pack depending on complexity. Transcription errors are common – a misread digit in a cable ID, a swapped connection, a missed node. These errors propagate downstream. Field teams arrive at job sites with incorrect information. Materials get ordered based on wrong cable lengths. Route planning breaks because the digital map doesn't match reality.
Why Existing Solutions Fall Short
Standard OCR doesn't solve this problem. Build pack diagrams aren't tables or structured text – they're visual representations of network topology. The spatial relationships between elements carry meaning. A node's position relative to other nodes matters. The routing of cable lines through the diagram encodes connection sequences.
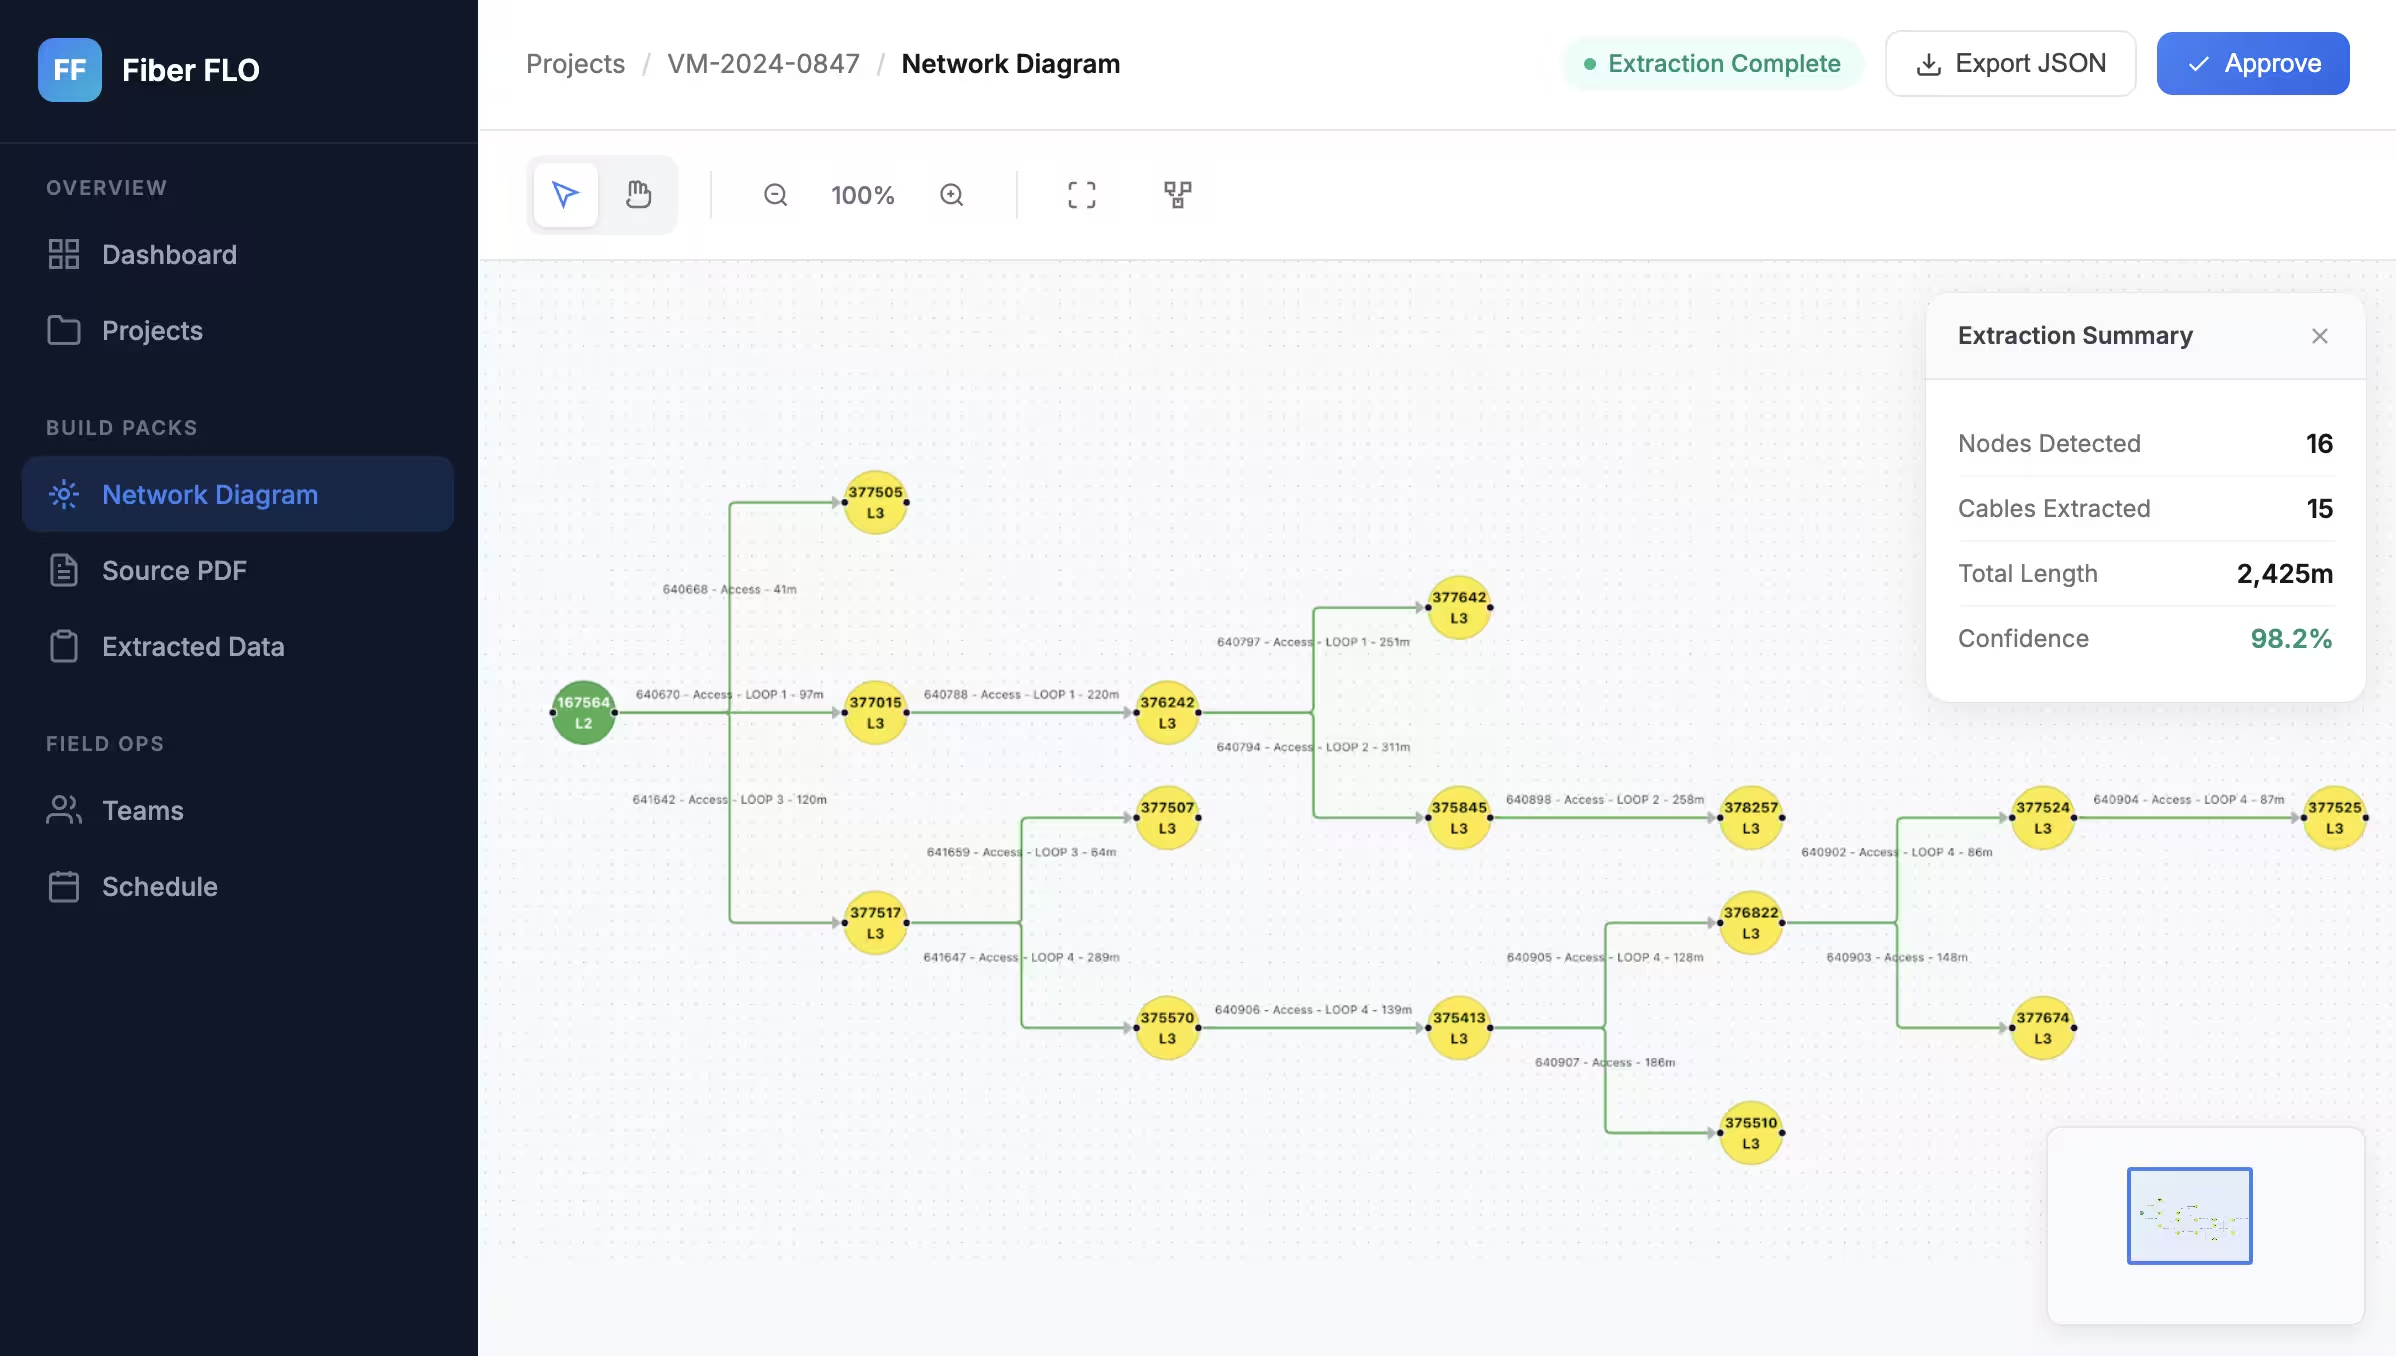
PDF text extraction captures labels but loses structure. You might extract "167564" and "377505" and "640668" as text fragments, but you've lost the information that 640668 is a cable connecting node 167564 to node 377505 with a length of 41 meters.
The problem requires understanding the diagram as a visual system, not just extracting text from it.
What We Built
An intelligent document processing pipeline that combines PDF manipulation, computer vision, and large language model capabilities. The system automatically extracts structured network topology data from build pack diagrams and renders them as interactive React Flow visualizations.
The pipeline works in three main stages: identify the diagram page, extract structured data through grid-based image processing, and visualize the results for user review.
Design Principles
We built this system around three core principles that shaped every technical decision.
Accuracy over speed. Field teams rely on extracted data for real-world installation work. A fast system that produces errors creates more problems than it solves. We optimized for extraction accuracy first, then worked backward to improve processing speed without sacrificing correctness.
Human-in-the-loop validation. AI extraction handles the heavy lifting, but humans make the final call. The system presents extracted data for review and approval before it enters production workflows. This catches edge cases and builds user trust in the automation.
Provider-agnostic architecture. Different network providers use different diagram formats, labeling conventions, and layout styles. The system needed to handle Virgin Media build packs the same day it handles Netomnia or Go Fibre documents. We designed flexible parsing prompts and schema validation that adapts to format variations.
Technical Implementation
Stage 1: Identifying the Cable Chain Straight Line Diagram
The system processes a PDF file to locate the page containing the Cable Chain Diagram. Depending on the build pack format, we handle two cases.
Case 1: Labeled Diagrams. If the diagram is labeled on the page, the system parses the PDF into text and prompts an LLM to return the page number where the diagram is found.
{
  "diagram_page": 12
}
Case 2: Unlabeled Diagrams. When build packs don't guarantee labeled diagrams, alternative approaches ensure reliable detection. Using Anthropic's PDF support, the system can extract images, interpret visual content, convert pages to images with text extraction, and provide insights into non-textual content. Alternatively, a custom approach with image-processing LLMs (Gemini 3.0 Pro, GPT-5) converts each page to an image and prompts the model to identify the diagram location.
Stage 2: Extracting the Cable Diagram as Structured Data
Once the diagram's page is identified, the system processes it into structured data through intelligent image segmentation and analysis.
Vector-First Quality Preservation. The PDF stays in vector format through cropping and sectioning operations. Conversion to high-resolution raster images happens only at the final analysis stage. This preserves text legibility and symbol recognition accuracy.
Grid Segmentation. Large diagrams exceed the context window of vision models. The system divides them into overlapping grid sections with configurable overlap (~20%). The rightmost portion of one image corresponds to the leftmost portion of the next, ensuring cables and connections spanning grid boundaries appear in multiple sections for complete context reconstruction.
AI-Powered Blank Detection. Before sending sections to the LLM, the system analyzes image statistics – color variance, standard deviation, and range across RGB channels – to identify empty or monotonous regions automatically. Skipping these sections reduces processing time by up to 60% and cuts API costs substantially.
LLM Vision Analysis. Each relevant grid section goes to the image-processing LLM (OpenAI GPT-5, Gemini 3.0 Pro, or Anthropic Claude 4.5 Sonnet) with structured prompts. The model identifies cable identifiers, node types and labels, connection relationships between elements, and hierarchical topology structures with accuracy comparable to human interpretation.
JSON Assembly. Results from all grid sections get merged, deduplicated using the overlap regions, and validated against a schema. The extracted data is stored and presented to the user for review and approval.
The output follows a clean schema:
{
  "nodes": [
    {
      "id": "167564",
      "type": "L2"
    },
    {
      "id": "377505",
      "type": "L3"
    },
    {
      "id": "377015",
      "type": "L3"
    }
  ],
  "cables": [
    {
      "id": "640668",
      "from": "167564",
      "to": "377505",
      "name": "Access",
      "length": 41
    },
    {
      "id": "640670",
      "from": "167564",
      "to": "377015",
      "name": "Access - LOOP 1",
      "length": 97
    }
  ]
}
This structured output ensures every node and cable is clearly defined, enabling precise visualization and interaction in later stages.
Stage 3: Visual Representation Using React Flow
Once structured data is extracted, the system constructs an interactive cable diagram using React Flow.
Dynamic visualization. The diagram reflects parsed cable data in an intuitive, graph-based format. Nodes display their IDs and types (L2, L3), while cables show connection details including cable ID, type, and length in meters. The visual hierarchy matches the logical hierarchy – L2 nodes anchor the network, L3 nodes branch outward.
Automatic layout with manual override. The system applies automatic layout algorithms to position nodes based on their connections. But automatic layouts don't always produce the clearest visual representation – sometimes the algorithm creates unnecessary crossings or awkward spacing. Users can drag, adjust, and reposition nodes to refine the layout for better clarity.
Interactivity for verification. Users can click on any node or cable to inspect its extracted data. Hover states highlight connected elements. This interactivity serves a practical purpose: it lets users verify that the AI extraction correctly captured the relationships in the original diagram.
User approval process. The system allows users to validate and correct any detected inconsistencies before finalizing the diagram. Found a missing cable? Add it manually. Spotted a wrong connection? Fix it in the interface. This human-in-the-loop step catches edge cases where AI extraction might miss or misinterpret elements, then feeds corrections back to improve future extractions.
Export and integration. Once approved, the structured data exports to JSON for database storage or API consumption. The React Flow diagram can embed directly in the Fiber FLO platform, giving field teams an interactive map they can reference during installation work.
Challenges We Solved
Building this system surfaced several technical challenges that required creative solutions.
Diagram Size vs. Model Context Windows
Cable chain diagrams can span large page dimensions with small text labels. Vision models have context window limits – you can't just feed them a massive high-resolution image and expect accurate text extraction.
Our solution: intelligent grid segmentation. We divide diagrams into smaller sections that fit comfortably within model context windows while maintaining enough resolution for accurate text recognition. The 20% overlap between sections ensures elements at grid boundaries appear in multiple sections. During JSON assembly, we deduplicate overlapping elements by matching IDs.
Blank Space Optimization
Build pack diagrams often contain large empty regions – whitespace around the network topology, unused corners of the page, areas between diagram clusters. Processing these blank sections wastes API calls and increases costs.
We implemented statistical blank detection that runs before LLM analysis. The system examines color variance, standard deviation, and RGB channel ranges for each grid section. Sections falling below variance thresholds get flagged as blank and skipped. This optimization reduces LLM API calls by approximately 60% on typical diagrams without risking missed content.
Provider Format Variations
Virgin Media diagrams don't look like Netomnia diagrams. Node labeling conventions differ. Cable ID formats vary. Layout styles change. A brittle system tuned for one provider would fail on others.
We addressed this through flexible prompt engineering and schema validation. The extraction prompts describe what to look for in abstract terms – "node identifiers," "connection relationships," "cable metadata" – rather than hardcoding specific formats. Schema validation ensures output consistency regardless of input variations. When a new provider format appears, we adjust prompts rather than rewriting extraction logic.
Maintaining Vector Quality
PDFs store diagrams as vector graphics – infinitely scalable without quality loss. But vision models need raster images. Converting too early in the pipeline degrades text clarity.
Our approach preserves vector format through all cropping and sectioning operations. Rasterization happens only at the final step, at 8x resolution, right before LLM analysis. This maximizes text legibility and symbol recognition accuracy.
Results
The proof-of-concept validated AI-powered build pack processing for the Fiber FLO platform.
90%+ reduction in time required to extract network topology compared to manual data entry.
Automated processing of multi-page build pack documents that previously required hours of manual interpretation.
~60% cost optimization by detecting and skipping monotonous blank sections, reducing LLM API calls on typical diagrams.
High accuracy in cable ID extraction, node identification, and connection mapping through AI vision analysis.
Structured JSON output ready for direct integration with Fiber FLO's interactive cable flow diagram system.
Format flexibility supporting multiple network provider formats through configurable processing parameters.
Beyond Fiber Installation
The techniques we developed for build pack parsing apply to any domain dealing with legacy PDF diagrams containing structured information.
Construction and engineering. Electrical schematics, plumbing diagrams, HVAC layouts – these documents share the same fundamental challenge. Structured information locked in visual format, requiring manual transcription to enter digital workflows.
Manufacturing. Assembly diagrams, process flow charts, equipment interconnection maps. Factories run on documentation that often exists only as PDFs or scanned drawings.
Utilities. Power grid topology, water distribution networks, gas pipeline maps. Infrastructure operators manage systems documented in formats that predate modern data management.
Architecture and real estate. Floor plans, site maps, building system diagrams. Property management involves constant reference to visual documentation that could benefit from structured extraction.
The core insight transfers: when visual diagrams encode structured relationships, vision-capable AI models can extract that structure into machine-readable formats. The specific implementation varies by domain, but the approach scales.
Why This Matters
Build pack processing is a bottleneck in fiber installation projects. Every hour spent manually transcribing diagrams delays project kickoff. Every transcription error creates downstream problems – wrong materials ordered, incorrect route planning, field team confusion.
For Fiber FLO's customers, eliminating this bottleneck means faster project setup, fewer errors, and better field coordination. Installation companies can onboard new projects in minutes instead of hours. Project managers focus on planning and coordination instead of data entry. Field teams get accurate digital maps they can trust.
This proof-of-concept demonstrates that AI vision systems can handle the complexity of real-world technical diagrams. The Fiber FLO team now has a validated path to integrating automated build pack parsing into their platform, with clear technical architecture and proven extraction accuracy.
The gap between static PDFs and dynamic digital workflows is closing. For industries built on legacy documentation, that gap represents opportunity.